
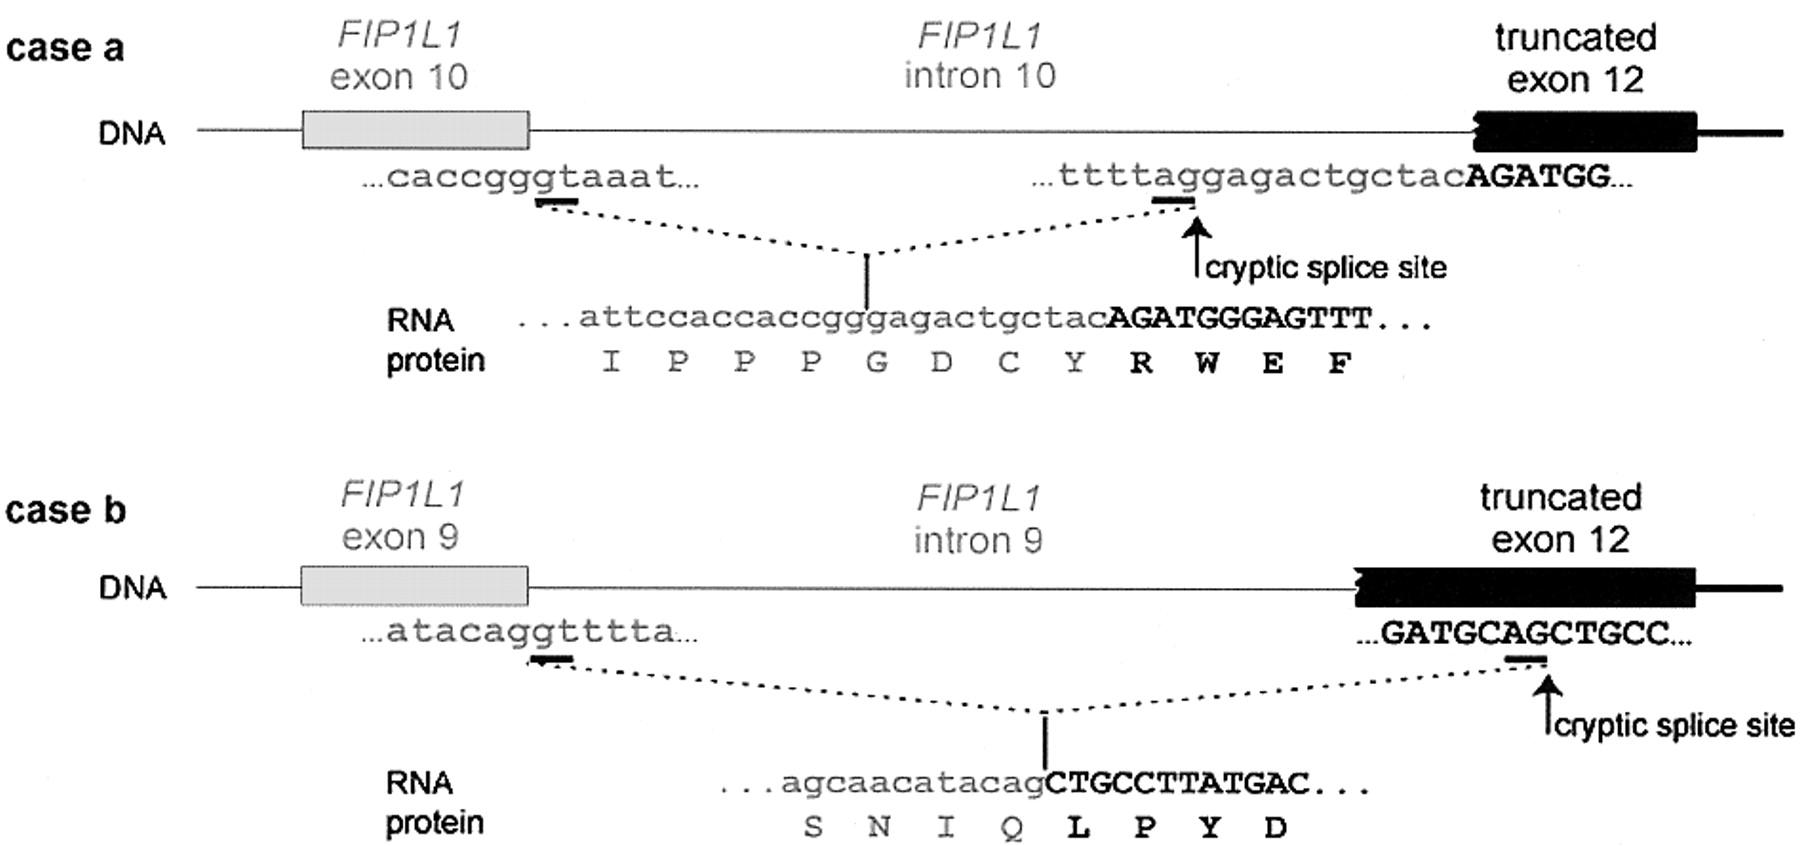
The purpose of this webpage is to know lots of characteristics of a novel fusion gene, FIP1L1-PDGFRA. This gene is a result of a 800-kb deletion in the chromosome 4 and it is present in some eosinophilic illnesses. The first part of this fusion gene is coming from FIP1L1 gene, a protein which plays an important role in the mRNA processing. The second part of the gene that we have been studying is the last part of PDGFRA gene, which function as an active kinase. We also can affirm that the domains present in each part of FIP1L1 and PDGFRA appear, as it is logical, in the fusion protein. The domains of the first part of FIP1L1 appear in the first part of the FIP1L1-PDGFRA protein and the domains of the last part of the PDGFRA protein appear in the last part of the fusion protein. Since there isn't a described orthologue for the fusion protein, we have verified that FIP1L1 and PDGFRA proteins follow the expected evolutionary history, as we show in some phylogenetic trees. Moreover, the transcriptional factors that regulate the FIP1L1 action also rule the FIP1L1-PDGFRA protein, due to the fact that the promotor region of the fusion protein is the same as the FIP1L1 protein. This prediction has been made with the PROMO server and with a perl programme made by us. The expression of PDGFRA is really important in the urinary tracts and in male and female genitals, whereas the FIP1L1 expression is present in the immunitary cells. It has to be said that scientist have demonstrated the expression of the FIP1L1-PDGFRA fusion protein in blood cells from patients with Idiopathic hypereosinophilic syndrome (HES). On the other hand, we have to said that FIP1L1 protein function as a component of cleavage and polyadenylation specificity factor (CPSF), which participates in the mRNA processing, whereas the PDGFRA protein has lots of functions we will explain futher on. Finally, we have to say that lots of studies have to be done to discover more things about this novel gene in order to find a drug to cure the illnesses. The FIP1L1-PDGFRA fusion gene is created by an 800-kb deletion on chromosome 4q12. In this link you can see the image of this 800-kb deletion. The deletion disrupts the FIP1-like-1 (FIP1L1) and the platelet-derived growth factor receptor-alfa (PDGFRA) genes and fuses the 5' part of FIP1L1 to the 3' part of PDGFRA. This fusion gene was discovered in two illnesses: Idiopathic hypereosinophilic syndrome (HES) and Chronic eosinophilic leukemia (CEL) . In each patient that shows this fusion gene the breakpoints in FIP1L1 and PDGFRA are different, but the FIP1L1-PDGFRA fusions are always in frame. The breakpoints in FIP1L1 are scattered over a region of 40 kb that comprises introns from 7 to 10, whereas the breakpoints in PDGFRA are restricted to a very small region that invariably involves PDGFRA exon 12. As the 5' part of exon 12 of PDGFRA is deleted, splicing of FIP1L1 exons to the truncated exon 12 of PDGFRA occurs by use of cryptic splice sites within exon 12 of PDGFRA or in introns of FIP1L1. In our case, we hypothesize that our fusion protein is the one we can see in the image below. [1,2,3] Fig.1 The fusion of FIP1L1 to PDGFRA involves the use of cryptic splice sites. In the picture we can see the splicing of FIP1L1 exons to the truncated exon 12 of PDGFRA as observed in 2 different HES patients. As the normal splice site in front of exon 12 is deleted, cryptic splice sites in the introns of FIP1L1 (as in case a) or within exon 12 (as in case b) are used to generate in-frame FIP1L1-PDGFRA fusions. As a result, the fusion protein sometimes contains a few extra amino acids derived from an intronic sequence of FIP1L1 (as in case a). [1] ![]() INTRODUCTION
INTRODUCTION
![]() MATERIAL AND METHODS
MATERIAL AND METHODS
![]() RESULTS AND DISCUSSION
RESULTS AND DISCUSSION
![]() Characterizing the genomic structures of the genes
Characterizing the genomic structures of the genes![]() Protein isoforms
Protein isoforms![]() Analysing the proteins domains
Analysing the proteins domains![]() Orthology and philogeny of FIP1L1 and PDGFRA genes
Orthology and philogeny of FIP1L1 and PDGFRA genes![]() Transcriptional factors
Transcriptional factors![]() Expression analysis of both genes
Expression analysis of both genes![]() Functional study
Functional study![]() CONCLUSIONS
CONCLUSIONS
![]() Back to the begining
Back to the begining
INTRODUCTION
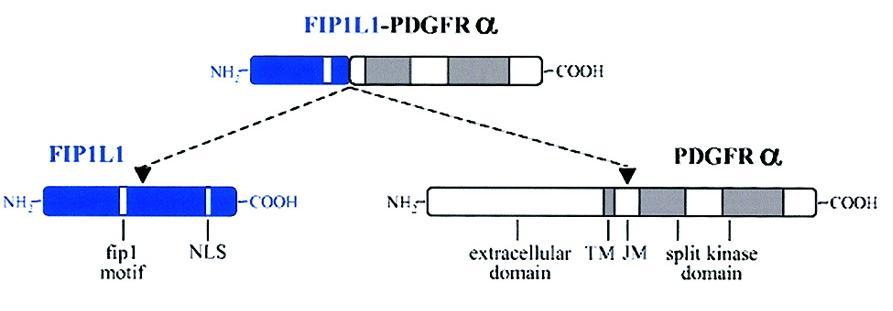 |
Fig.2 In this image you can see a schematic representation of the FIP1L1, PDGFRA and FIP1L1-PDGFRA fusion proteins. [1] |
The two illnesses that we have mentioned before have a common symptom that is a hypereosinophilia. In the majority of pacients with this illnesses scientists have found an activated fusion tyrosine kinase on chromosome 4q12. This activated fusion tyrosine kinase is produced by the interstitial deletion we have talken above. The fusion gene transforms the hematopoyetic cells and it is the target of farmacs against HES and CEL. This is the gene of our study in this webpage. [1,4]
Let's introduce a few things about the illnesses. Persistent nonreactive hypereosinophilia, defined as an unexplained elevated eosinophil count (more than 1.5 x 10⁹ per liter) sustained over 6 months, characterizes both chronic eosinophilic leukemia (CEL) and idiopathic hypereosinophilic syndrome (HES). Tissue damage, resulting from direct infiltration by eosinophils and cytokine release, leads to progressive organ dysfunction that may be fatal. HES is a myeloproliferative disease of unknown etiology. Recently, it has been reported that imatinib mesylate (Gleevec), an inhibitor of Bcr-Abl kinase useful in the treatment of chronic myeloid leukemia, is also effective in treating HES. However, the molecular target of imatinib in HES is unknown. [3,5,6]
Scientists have identified a cell line called EOL-1 which has the fusion gene. They use this EOL-1 as an in vitro model for the study of FIP1L1-PDGFRA-positive chronic eosinophilic leukemia and for the analysis of small molecule inhibitors of FIP1L1-PDGFRA. These results demonstrate that most HES cases are clonal in origin and could be reclassified as FIP1L1-PDGFRA-positive CEL. Expression of the FIP1L1-PDGFRA fusion is under control of the ubiquitous FIP1L1 promoter, suggesting the possibility that FIP1L1-PDGFRA may be involved in the pathogenesis of other hematologic malignancies. [2,3]
This webpage began with a protein sequence that gave us the teacher. With this sequence we had to know which gene was, which protein could be and we had to do lots of studies with this sequence to know the location, the chromosome, the orthologous in other species, main domains and transcripts of the protein, principal transcriptional factors that binds with our sequence and some information of the expression and functions of the genes. Furthermore, we ought to do a perl programme to predict which transcriptional factors could bind with the promotor sequence.
To do all this parts of this work, we have used lots of data processing sources and programmes that we will comment and descript in this part:
To sum up this part, we show a table that will allow you to go to the databases and sources that we have used in this work. Look out because in Internet there is a lot of information and you have to be conscient of what you really want.
| Blast | Ensembl | UCSC | Uniprot |
| ClustalW | Mega | RevTrans | Biomart |
| Gene sorter | VisiGene | PubMed | PROMO |
In this section we will see the genomic structure of the two genes: where they are located in the chromosomes, how many transcripts they have, how many exons have each transcript, which of these exons are coding and this sort of things. Moreover, we have compared the transcripts of each gene. Finally, we discuss about the whole fusion gene characteristics [28,29].
The accession number of the FIP1L1 gene in the databases is ENSG00000145216. This gene can be found on chromosome 4 at location 53,938,620-54,020,599. The start of this gene is located in Contig AC098821.3.1.80845. As we have said before, this gene is rearranged in hypereosinophilia.
As you can see in this table this gene has 3 transcripts.
| TRANSCRIPT | CE | NCE | Bp | R | I |
| Transcript 1 | 15 | 0 | 1932 | 520 | |
| Transcript 2 | 18 | 0 | 2154 | 594 | |
| Transcript 3 | 18 | 0 | 2100 | 594 | |
Fig.2 CE = Coding exons, NCE = Non-coding exons, Bp = Base-pairs, R = Residues and I = Image
The three transcripts of FIP1L1 are different. We have chosen transcript number two to compare it with the other ones and we can observe the following things:
You can see all we have explained in this alignment, where we have aligned the three different transcripts of FIP1L1 [31].
The accession number of the PDGFRA gene is ENSG00000134853. It is located on chromosome 4 at location 54,819,693-54,856,196. The start of this gene is in Contig AC138779.2.1.132003.
This gene has two transcripts.
| TRANSCRIPT | CE | NCE | Bp | R | I |
| Transcript 1 | 22 | 1 | 6390 | 1089 | |
| Transcript 2 | 22 | 1 | 6390 | 1089 | |
Fig.2 CE = Coding exons, NCE = Non-coding exons, Bp = Base-pairs, R = Residues and I = Image
The only difference between these two transcripts is in the UTR regions. The first transcript has a sequence forming part of the 3'-UTR region of the first exon which is out of the first exon in the second transcript. The second transcript has three nucleotides forming part of the 5'-UTR region of the last exon which are out of the last exon in the first transcript.
You can see all we have explained in this alignment, where we have aligned the two different transcripts of PDGFRA [31].
We have looked for the sequence of the orthologues to find out if this first exon is coding or not. In Mus musculus the first exon is non-coding as it happens in the human gene. Nevertheless, in Rattus norvegicus we find two transcripts, one with a coding first exon and the other with a non-coding first exon. So we can't take any conclusions of this observations.
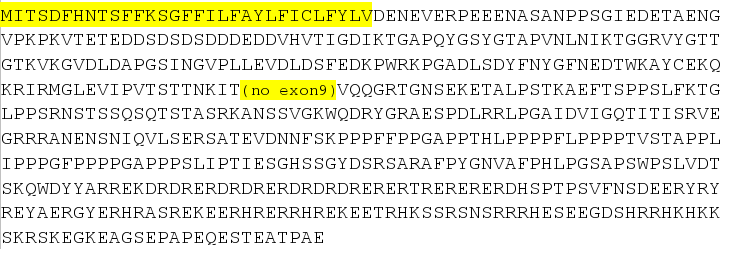
To find which exons of PDGFRA protein and FIP1L1 protein made the FIP1L1-PDGFRA protein we have looked at the different exons of the two proteins. The fusion protein FIP1L1-PDGFRA is made by the first twelve exons of FIP1L1 and from exon 12 to exon 23 of PDGFRA protein. We should say that from exon 12 of PDGFRA protein there are only the last 17 aminoacids. We have aligned the protein sequence of the three proteins to see clearly how they are constructed. If you want to see this alignment click here.
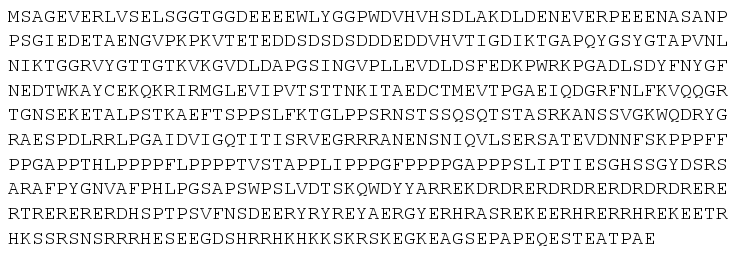
You can look at the FIP1L1 protein sequence in this link, the PDGFRA protein in this other and the fused protein FIP1L1-PDGFRA in that one.
We have also looked at the genes which are between FIP1L1 and the PDGFRA, since they can be affected by the 800-kb deletion we have talken before. Between the FIP1L1 gene (chr4 53,979,608) and the PDGFRA gene (chr4 54,824,686) we can find the following genes.
In this point we will analyse and compare the different protein isoforms of each gene. As we have said before each gene has differents transcripts, so we can think in different protein isoforms due to alternative splicing [28,29].
As the gene has three different transcripts, we expected three isoforms of the protein. Having searched in the Ensembl webpage, we find out three transcripts each one corresponding to one transcript. But when we looked for it in Uniprot we notice the presence of four transcripts. We have compared the isoform sequence with the transcript sequence to see an approach of which exons constitute each isoform. The conclusions we have reached are explained in the table below. If you click on the sequence you will be able to see the isoform sequence.
| NAME | DESCRIPTION | SEQUENCE |
| Isoform 1 | This is the isoform that represents the larger transcript of FIP1L1. Its length is 594 aa and its molecular weight is 66526 Da. We consider that this isoform is the protein that have all parts and importants domains that FIP1L1 needs. So, to do all studies or predictions of the fusion protein we have used this isoform. | Isoform 1 sequence |
| Isoform 2 | This is the sequence of the second isoform. If we compare it with the first one, we see that this isoform has a different begining because it have a new exon or sequence, marked in the link in yellow, and continues with the third exon of isoform 1. It has more differences because in this isoform exon 9 is deleted. If we quantify this isoform, we could say that it has 559 aa and its weight is 63048 Da. | Isoform 2 sequence |
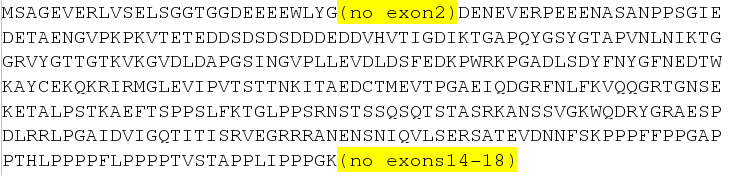
| Isoform 3 | It is the third isoform that we find in Ensembl. Its length is 378 aa and its molecular weight is 40835 Da. If we compare it to the first one we see that in this isoform there are some exons deleted due to the splicing proceses: exon 2 and 14-18. So this is a shorter isoform than the others. | Isoform 3 sequence |
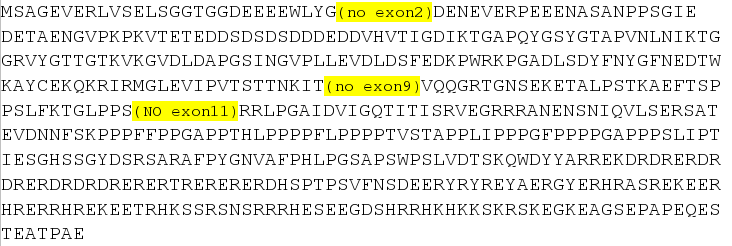
| Isoform 4 | We find another isoform in Uniprot that match exactly with the first transcript that appears in the Ensembl Database. This is an isoform in which exon 2, 9 and 11 are deleted. | Isoform 4 sequence |
In this point we have to say that we have only explained the differences that we have considered more important, but when we analised the isoform sequences residu by residu we found more differences. Here you can see the alignment we have done with the 4 different isoforms to see all the differences and to be sure about our explanations about each isoform [31].
In this case we expected two isoforms because as we have said this gene has two transcripts. We can see that our prediction is correct but the second isoform doesn't match with any of the transcripts that we have described because is a very short isoform.
| NAME | DESCRIPTION | SEQUENCE |
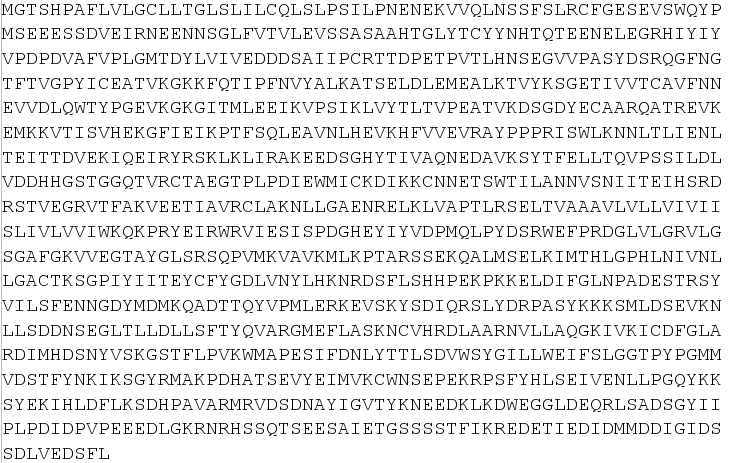
| Isoform 1 | We have considered that this isoform is the whole PDGFRA protein and the one which have all the domains and is functional. It has the same structure that we have explained before of the PDGFRA gene. | Isoform 1 sequence |
| Isoform 2 | This is the second isoform that we have found of the PDGFRA gene. It is very short if we compare it to the first one because it only has the first 4 exons. It has 218 aa of lenght | Isoform 2 sequence |
We also have aligned the two isoforms to see if our conclusions were true and to look for more little differences that we haven't explained because they are very little. If you want to see this alignment you can click here [31].
As we have said before the fusion protein is formed by the first part of the FIP1L1 protein and the last part of the PDGFRA protein. You can see this fact in the following link [31].
![]() Back to the begining
Back to the begining
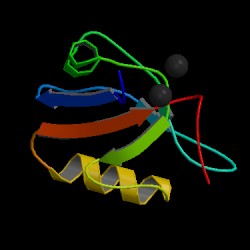
In this part we will analyse the main domains of both proteins and we will predict which domains have our fusion protein. In this links you will find the explanation of the domains of each protein. Click FIP1L1 domains to see the analysis of this protein domains and PDGFRA domains too see the domains of this second protein [30,31,35].
This is prediction of Blast that predict which domains has the fusion protein.
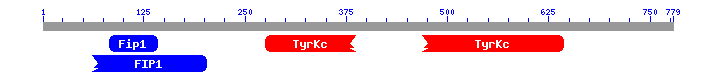
As we expected and how shows the Blast prediction, our fusion protein has the domains of the first part of FIP1L1 and the domains of the last part of PDGFRA. We have to remember that our fusion protein is made by the first part of FIP1L1 and the last part of PDGFRA, so it is logical that the fusion protein shows the characteristic domains of each part of the proteins. As we can see the first part of the fusion protein has a FIP1 domain and the second part of the protein has a tyrosine protein kinase domain. We have contrast these results with the InterPro [31] webpage and the results match. InterPro also shows that the fusion protein has a protein kinase domain and a receptor tyrosine kinase domain. If you want you can see these results in the following page.
In this part we have been analysing the orthologues genes of PDGFRA and FIP1L1 and we have done phylogenetic trees of both genes to give more information about its homology and orthology evolution. Furthermore, we have studied the gene and its family. In the case of FIP1L1 gene we can't do this family tree because this gene doesn't has a family. However, we can say that this gene have a functional domain (FIP) that we can find in other species. For PDGFRA gene we have done a tree of the family gene mixed with orthologues genes to try to investigate when this gene had appeared in the evolution [29,31,32,33].
It is necessary to say too that our fusion gene only appear in Homo sapiens and we can't do any tree about this fusion protein. This protein only appears in disease situations, where the 800-kb region disappear.
Before we show the phylogenetics trees we have done two tables of the orthologues genes for PDGFRA and FIP1L1 genes and its homology percentage.
As you can see in the table below and as we expected, the higher is the homology between the orthologues the closer is the animal evolutionary to the human. We have taken this values from the Ensembl webpage, concretely the query value, and we verified these values with the Biomart database. If you click on the image you will see the alignment between this specie and human.
| Specie | % Homology | Specie | % Homology | Specie | % Homology |

Pan troglodytes |
100 | 
Ornithorhynchus anatinus |
75 | 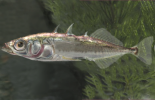
Gasterosteus aculeatus |
52 |

Macaca mulatta |
99 | 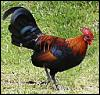
Gallus gallus |
79 | 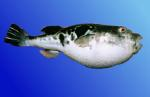
Takifugu rubripes |
46 |

Mus musculus |
87 | 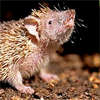
Echinops telfairi |
77 | 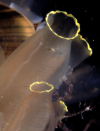
Ciona intestinalis |
24 |
Rattus norvergicus |
93 | 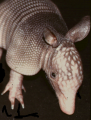
Dasypus novemcinctus |
69 | 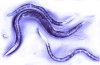
Caenorhabditis elegans |
21 |

Canis familiaris |
92 | 
Xenopus tropicallis |
68 | 
Aedes aegypti |
21 |

Bos taurus |
98 | 
Tetraodon nigroviridis |
48 | 
Sacharomyces cerevisiae |
11 |

Oryctolagus cuniculus |
79 | 
Danio rerio |
56 | 
Anopheles gambiae |
21 |

Loxodonta africana |
85 | 
Oryzias latipes |
55 | 
Drosophila melanogaster |
20 |
We believe that species with a high percentage mean that these species have orthologues genes of FIP1L1. As a high percentage we consider more thant 40%. However, species which have a low percentage, although Ensembl and Biomart say that are orthologues genes we think that these species have similarity from human sequence because this gene has the FIP1 domain that we can find in other genes. So, we believe that species which have a percentage under 40% aren't really orthologues genes.
As you can see in the table below and as we expected, the higher is the homology between the orthologues the closer is the animal evolutionary to the human. We have taken this values from the Ensembl webpage but a few days later they took it out from the webpage, so maybe they aren't correct. These values appeared in the december release of Ensembl. We decided to take the values from Biomart and compare it with the ones provided by Ensembl, but in Biomart we didn't find any homology values for PDGFRA. In this webpage, we only found the Platelet-Derived Growth Factor Receptor Beta (PDGFRB) values. Finally, we decided to show the Ensembl values although we are not absolutely sure about these values.
| Specie | % Homology | Specie | % Homology |
|
Pan troglodytes |
96 |
Gallus gallus |
81 |
|
Macaca mulatta |
98 |
Loxodonta africana |
79 |
|
Canis familiaris |
95 |
Ornithorhynchus anatinus |
61 |
|
Bos taurus |
94 |
Xenopus tropicallis |
74 |
|
Rattus norvergicus |
91 |
Orcytolagus cuniculus |
63 |
|
Mus musculus |
91 |
Echinops telfairi |
68 |

Monodelphis domestica |
83 |
We believe that species with a high percentage mean that these species have orthologues genes of PGFRA. As a high percentage we consider more than 40%. However, species which have a low percentage, although Ensembl says that are orthologues genes we think that these species have similarity from human sequence because this gene has domains, for example the kinasa domain, that we can find in other genes. So, we believe that species which have a percentage under 40% aren't really orthologues genes.
To go on with this homology part we have done phylogenetic trees to investigate a little bit more about the evolutionary history of our genes. Here we show the results.
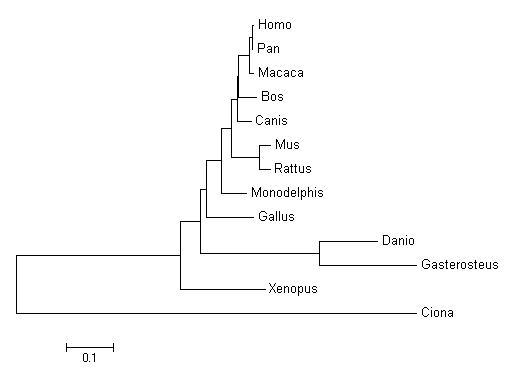
We have done the tree of all orthologues of FIP1L1 gene and we have obtained this phylogenetic tree. If we observe the tree, we can see that this gene follows the phylogeny of the species because we find clusters of species that are genetically similars. If we analyse the tree we will find that the lower genetic distance is within a cluster that include Homo sapiens, Pan troglodytes and Macaca mulatta. We can find other clusters that include other species, like the cluster of some fish species (Danio and Gasterosteus). All this clusters and the fact that Ciona is the furthest specie in the tree give us strong evidence that the tree corresponds with the reality. So, we can think that these genes are really orthologues because they reproduce the species evolution.
In this case we haven't done a family gene tree because this gene doesn't belong to a family gene. We had tried to do a tree with the Fip domain in different species but we didn't get concloent results.
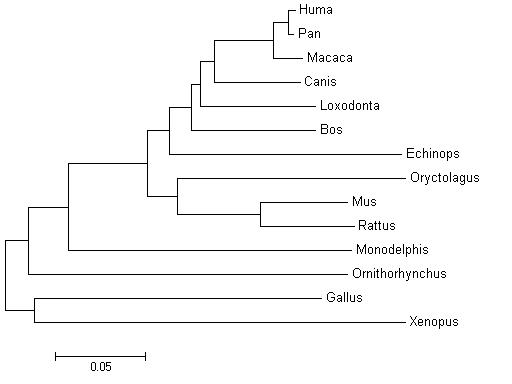
We have done the tree of all orthologues of the PDGFRA gene and we have obtained this phylogenetic tree. If we observe the tree we can see that this tree follows the phylogeny of species because we can find clusters of species that are genetically similars. If we analyse the tree we find that the lower genetic distance is within a cluster that includes Homo sapiens, Pan troglodytes and Macaca mulatta. We can find other clusters that includes other mammals like the cluster of the rodents. All this clusters and the fact that Xenopus is the furthest specie in the tree give us strong validation of this tree. So, we can think that these genes are really orthologues because they reproduce the species evolution.
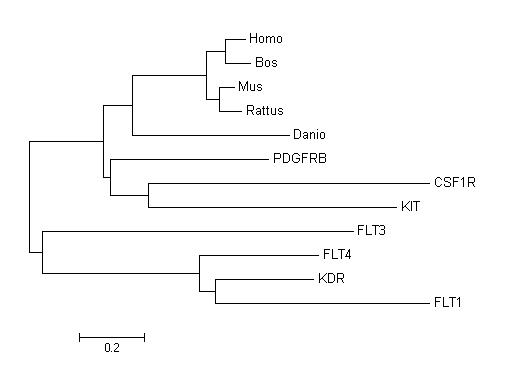
We also have done a tree between the family gene of PDGFRA (PDGFRB, KIP ...) and the orthologues genes of PDGFRA. Studying this tree we can conclude that this family gene appeared before the diversification of species because if we observe, this tree have three differenced clusters: in the first cluster we can find the family genes which are less similar to the PDGFRA gene (FLT1, FLT3, FLT4 and KDR), in another cluster there are the family genes which are more related to the PDGFRA gene(CSF1, KIT and PDGFRB) and the last cluster where there are the ortologues genes of PDGFRA (Bos taurus, Homo sapiens, Mus musculus, Rattus norvergicus and Danio renio). It is logical that the second and the first clusters are linked, because these genes of the family are very similar to the PDGFRA. If a member of the family gene hadn't appeared before the diversification of species, for example as a result of a duplication in mammals, we would have found a family gene member in the mammal cluster.
In this part we have to say that the human FIP1L1-PDGFRA protein doesn't has a described orthologue. We have to remember that this fusion protein appears due to a 800-kb deletion in the chromosome 4. We could hypothesize that maybe this deletion occurs in some animals but nobody has studied it and for this reason there isn't a described orthologue for the fusion protein. However, to produce the fusion protein the two proteins would have to be in the same chromosome. But this is no true at all, because in some illnesses fusion proteins appear due to chromosomic translocations. So, the only thing we can be sure about is the fact that more studies have to be done in animals to find out if this fusion protein appears also in animals or not.
![]() Back to the begining
Back to the begining
The first we have to do in this section is to get the promotor sequence. To get our promotor regions we went to the UCSC Genome Browser and we took out a DNA region comprising 1000 bp before the Transcriptional Start Site (TSS) and 100 bp after the TSS. Here you can see the region we have taken to analise the FIP1L1 gene and here the region of the PDGFRA gene [29] in FASTA format.
We have done an analysis of the promotor region of both genes to study which transcriptional factors probably bind with these sequences. With this purpose we used the PROMO server to take those transcriptional factors which bind to the promotor of the genes. Then we just selected those which have a RE Equally lower than 0'9 and the dissimilarity lower than 1%. We also have looked at the sequence lenght, since the longer it is the better it is as a transcriptional factor because it is more difficult to be equal to a long sequence than to a short one by chance [34].
Here we show two tables where you can see the transcripcional factors that are predicted to bind to the promotor region and some important information about them. In these tables you will find information about: the coordenates where you can find the transcriptional factor binding site in the promotor sequence; the dissimilarity between the consensus pattern and the promotor region, the lower it is the higher is the similarity between the consensus pattern and the region you are looking at; the sequence that binds with the transcriptional factor; the RE equally value that give information about how many sites you will find in a sequence with the same lenght as yours and made by a 25% of each nucleotide, the lower it is the better is the site you have found; and a brief general description of each transcriptional factor [35].
| TF | C | Dissimilarity | Sequence | RE Equally | Description | ||
| Sp1 | 849-858 | 0,000000 | GGGGCGGGGC | 0,00105 | Transcriptional factor that takes part of a complex that interacts with Pol II promoter and does a positive regulation of the transcription. | ||
| Elk-1 | 810-858 | 0,000000 | GGGAGGAAG | 0,03360 | Transcriptional factor that interacts with JUN, another transcriptional factor. | ||
| HNF-1A | 494-501 | 0,000000 | TTTTTAAC | 0,13440 | Transcriptional factor. | ||
| c-Ets-1 | 1002-1008 | 0,000000 | CTTCCTG | 0,13440 | Proto-oncogene that is involved in some cancer diseases. | ||
| GR | 95-101 | 0,000000 | TTTTTTG | 0,20160 | Transcriptional factor. | ||
| GR | 557-563 | 0,000000 | TTTTTTG | 0,20160 | Transcriptional factor. | ||
| STAT4 | 382-387 | 0,000000 | GGAAAT | 0,26880 | Transcriptional factor of the STAT family implicated in apoptosis. | ||
| AP-2alphaA | 871-876 | 0,000000 | GCAGGC | 0,53760 | A part of the transcripcional factor AP2. | ||
| TFIID | 264-270 | 0,000000 | TAAAAAA | 0,60480 | TFIID is composed of the TATA-binding protein (TBP) and a group of evolutionarily conserved proteins known as TBP-associated factors or TAFs. His function is help the RNA polymerase II. | ||
| TFIID | 494-500 | 0,000000 | TTTTTAA | 0,60480 | TFIID is composed of the TATA-binding protein (TBP) and a group of evolutionarily conserved proteins known as TBP-associated factors or TAFs. His function is help the RNA polymerase II. | ||
| TFIID | 558-564 | 0,000000 | TTTTTGA | 0,60480 | TFIID is composed of the TATA-binding protein (TBP) and a group of evolutionarily conserved proteins known as TBP-associated factors or TAFs. His function is help the RNA polymerase II. | ||
| TFIID | 673-679 | 0,000000 | TTAAAAA | 0,60480 | TFIID is composed of the TATA-binding protein (TBP) and a group of evolutionarily conserved proteins known as TBP-associated factors or TAFs. His function is help the RNA polymerase II. | ||
| TFIID | 674-680 | 0,000000 | TAAAAAA | 0,60480 | TFIID is composed of the TATA-binding protein (TBP) and a group of evolutionarily conserved proteins known as TBP-associated factors or TAFs. His function is help the RNA polymerase II. | ||
| TFIID | 761-767 | 0,000000 | TTAAAAA | 0,60480 | TFIID is composed of the TATA-binding protein (TBP) and a group of evolutionarily conserved proteins known as TBP-associated factors or TAFs. His function is help the RNA polymerase II. | ||
| Pax-5 | 882-888 | 0,000000 | CAGGCCC | 0,60480 | Its factor encodes the B-cell lineage specific activator protein (BSAP) that is expressed at early, but not late stages of B-cell differentiation. | ||
| FOXP3 | 358-363 | 0,000000 | CACAAC | 0,80640 | Transcriptional factor. | ||
| TFII-I | 603-608 | 0,000000 | GGAAAG | 0,80640 | Transcriptional factor that interacts with elk-1. | ||
| c-Ets-1 | 812-818 | 0,128087 | GAGGAAG | 0,13440 | Proto-oncogene that is involved in some cancer diseases. | ||
| AP-2alphaA | 881-886 | 0,226186 | CCAGGC | 0,53760 | A part of the transcripcional factor AP2. | ||
| c-Ets-1 | 281-287 | 0,256174 | AAGGAAG | 0,13440 | Proto-oncogene that is involved in some cancer diseases. | ||
| GATA-1 | 42-47 | 0,280028 | TATCTT | 0,53760 | Globin transcriptional factor 1. | ||
| GATA-1 | 211-216 | 0,280028 | TAGATA | 0,53760 | Globin transcriptional factor 1. | ||
| C/EBPalpha | 576-582 | 0,540941 | GATTGTG | 0,13440 | Transcriptional factor that bind to the C/EBP/c-Myb sites using HL-60 nuclear extracts. | ||
| Sp1 | 776-785 | 0,574521 | GGGGCGGGGA | 0,00420 | Transcriptional factor that take part of a complex that interacts with Pol II promoter and does a positive regulation of the transcription. | ||
| HNF-1A | 107-114 | 0,781639 | GTTAAAAG | 0,26880 | Transcriptional factor. | ||
| RXR-alpha | 1047-1053 | 0,848226 | GGGTTCG | 0,26880 | Transcriptional factor related to the steroid hormone. | ||
Fig.2 TF = Transcriptional Factor, C = Coordenates
If we look at these results and knowing what is the function of the FIP1L1 protein, it is logical that the transcriptional factor binding site with the lowest dissimilarity and RE Equally is Sp1. FIP1L1 acts during the poliadenylation and Sp1 is a transcriptional factor that takes part in a complex that interacts with the Pol II promotor. The other transcriptional factor binding site that we think we should remark is TFIID, because it appeared in different parts of the sequence with a low dissimilarity and a low RE Equally. This transcriptional factor also takes part in the mRNA processing. So, we can see that the FIP1L1 protein takes part in the mRNA processing as well as the two transcriptional factors.
| TF | C | Dissimilarity | Sequence | RE Equally | Description |
| Sp1 | 758-767 | 0,574521 | TCCCCGCCCC | 0,0042 | Transcriptional factor that takes part in a complex that interacts with Pol II promoter and does a positive regulation of the transcription. |
| RAR-beta | 55-64 | 0,000000 | AGGGTTCGAC | 0,0042 | Transcriptional factor that binds with steroid hormone. |
| HNF-3A | 887-894 | 0,000000 | TATTTTGA | 0,0504 | Transcriptional factor. |
| NF-1 | 500-507 | 0.000000 | TTGGGCCG | 0,0672 | Transcriptional factor related to neurofibromatosis. |
| GR | 161-167 | 0,000000 | TTTTTTG | 0,20160 | Transcriptional factor. |
| GR | 822-828 | 0,000000 | CAAAAAG | 0,20160 | Transcriptional factor. |
| STAT4 | 660-665 | 0,000000 | GGAAAT | 0,26880 | Transcriptional factor of the STAT family implicated in apoptosis. |
| STAT-4 | 920-925 | 0,000000 | ATTTCC | 0,26880 | Transcriptional factor of the STAT family implicated in apoptosis. |
| TFIID | 590-596 | 0,000000 | TTTTCAA | 0,60480 | TFIID is composed of the TATA-binding protein (TBP) and a group of evolutionarily conserved proteins known as TBP-associated factors or TAFs. His function is help the RNA polymerase II. |
| TFIID | 957-963 | 0,000000 | TTTTAGA | 0,60480 | TFIID is composed of the TATA-binding protein (TBP) and a group of evolutionarily conserved proteins known as TBP-associated factors or TAFs. His function is help the RNA polymerase II. |
| TFIID | 1002-1008 | 0,000000 | TTTTTGA | 0,60480 | TFIID is composed of the TATA-binding protein (TBP) and a group of evolutionarily conserved proteins known as TBP-associated factors or TAFs. His function is help the RNA polymerase II. |
| C/EBPalpha | 809-815 | 0,000000 | GATTGCG | 0,1344 | It is a nuclear protein and it is a transcriptional regulator. |
| C/EBPalpha | 835-841 | 0,000000 | CGCAATC | 0,0,1344 | It is a nuclear protein and it is a transcriptional regulator. |
| C/EBPalpha | 393-399 | 0,540941 | TCCCCGCCCC | CCCAATC | It is a nuclear protein and it is a transcriptional regulator. |
| IRF-2 | 232-237 | 0,000000 | AAGTGA | 0,2688 | IFN regulatory protein. |
| Pax-5 | 1077-1083 | 0,000000 | GGGCACG | 0,60480 | Its factor encodes the B-cell lineage specific activator protein (BSAP) that is expressed at early, but not late stages of B-cell differentiation. |
| FOXP3 | 771-776 | 0,000000 | GTTGTT | 0,80640 | Transcriptional factor. |
| FOXP3 | 774-779 | 0,000000 | GTTGTC | 0,80640 | Transcriptional factor. |
| TFII-I | 695-700 | 0,000000 | CTTTCC | 0,80640 | Transcriptional factor that interacts with elk-1. |
| TBP | 540-549 | 0,935771 | TTTATATTCT | 0,0672 | TATA-binding protein. |
| SRY | 211-219 | 0,999172 | AAAACAAAG | 0,0336 | Transcriptional factor related in transcription process. |
| GATA-1 | 199-204 | 0,00000 | GAGATA | 0,53760 | Globin transcriptional factor 1. |
| GATA-1 | 227-232 | 0,00000 | GAGATA | 0,53760 | Globin transcriptional factor 1. |
| GATA-1 | 173-178 | 0,105011 | GAGATA | 0,53760 | Globin transcriptional factor 1. |
| RXR-alpha | 445-452 | 0,818075 | CTAGTTCA | 0,0672 | Transcriptional factor that interact with the retinal acid receptor. |
| RXR-alpha | 56-62 | 0,848226 | GGGTTCG | 0,0672 | Transcriptional factor that interact with the retinal acid receptor. |
| RXR-alpha | 799-805 | 0,848226 | TGGACCC | 0,0672 | Transcriptional factor that interact with the retinal acid receptor. |
| PR B | 384-390 | 0,48823 | AACAGTT | 0,0672 | Retinoblastoma protein. |
| PR A | 1047-1053 | 0,48823 | AACAGTT | 0,0672 | Retinoblastoma protein. |
| PR B | 1015-1021 | 0,00000 | TACTGTT | 0,2016 | Retinoblastoma protein. |
| PR A | 1015-1021 | 0,00000 | TACTGTT | 0,2016 | Retinoblastoma protein. |
Fig.2 TF = Transcriptional Factor, C = Coordenates
Looking at these results we should remark that the transcriptional factor Sp1 appears again. The PDGFRA protein is a receptor for growth factors that regulate the cell cicle, so it is logical that transcriptional factors binding sites which regulate the transcription are found in this protein. Another transcriptional factor binding site we can found in the promotor is for RAR-beta, a transcriptional factor that bind with steroid hormone.
We also have done a program which does an aproximation to the transcriptional factors which bind with the promotor sequence. If you want to see the perl program click here. The promotor sequence must be in FASTA format. This program give us a result where you can see the maximum score, the p-value, the name of the transcriptional factor, the position of the first and the last nucleotide of the sequence with the maximum score and the sequence with this maximum score. To calculate the p-value, the programme randomize the promotor and calculates if the score it gets is higher than the score it get with the original promotor. It repeats this process 100 times. The p-value is the result of dividing the times the score by chance is higher than the original by 100. So, the lower it is the better is the site as a transcriptional factor binding site. On the other hand, the score that give us the programme means how good is the sequence as a transcriptional factor binding site, but we always have to compare it to the p-value. So the best tranzcriptional factor binding site will be the one which have a high score and a low p-value.
You can redirect the values that the program give to you in the terminal to a text file. In this way, you can sort it by the higher score. You can do it by the following command in UNIX: sort -n -r. This command sort the file by numeric order and reverse the result. Doing all these things you get a list with your best transcriptional factor binding sites in the top. If you want to see the results of our genes click FIP1L1 results or PDGFRA results.
Now we will compare the results we have obtained with the PROMO server with the ones we have obtained with our program. In the following table we will show the transcriptional factor (TF), the score provided by our program, the p-value associated and finally the % of dissimilarity we have to work at with PROMO to find the prediction as ours.
| TF | SCORE | P-VALUE | % |
| PU.1 | 7.94 | 0.09 | Doesn't predicted |
| RXR-alpha | 6.39 | 0.2 | 23 |
| NF-AT1 | 6.11 | 0.55 | 10 |
| YY1 | 5,66 | 0.55 | 0 |
| AP-1 | 4.43 | 0.47 | 22 |
| AR | 5.01 | 0.93 | 21 |
| HNF-4 | -990.98 | 0.31 | Doesn't predicted |
| c-Myc | -991.77 | 0.46 | 34 |
| SRF | -991.77 | 0.53 | Doesn't predicted |
| NF-kappaB | -991.14 | 0.49 | Doesn't predicted |
| HIF-1 | -992.53 | 0.86 | 19 |
| AhR | -992.2 | 0.86 | Doesn't predicted |
| NRSF | -993.8 | 0.5 | Doesn't predicted |
| TF | SCORE | P-VALUE | % |
| HNF-4 | 8.32 | 0.1 | Doesn't predicted |
| NF-AT1 | 6.25 | 0.47 | 4 |
| YY1 | 5.71 | 0.75 | 0 |
| RXR-alpha | 5.55 | 0.61 | 49 |
| PU.1 | 4.89 | 0.54 | Doesn't predicted |
| NRSF | -990.52 | 0.36 | Doesn't predicted |
| c-Myc | -991.99 | 0.85 | 34 |
| AhR | -991.87 | 0.63 | Doesn't predicted |
| AP-1 | -991.26 | 0.78 | 31 |
| HIF-1 | -992.29 | 0.87 | 18 |
| SRF | -992.25 | 0.63 | Doesn't predicted |
| NF-kappaB | -992.15 | 0.87 | Doesn't predicted |
| AR | -992.1 | 0.92 | Doesn't predicted |
As you can see, the results with the two ways we have used are very different. This is something we expected to happen because our programme and PROMO use different ways to solve the same problem. And we also have used different transcriptional factors than the ones we have used with PROMO, since with our programme we have used the transcriptional factors provided by the teacher.
But what we don't expected is that the results were so different. We were quite worried about this and we didn't find any explanation for the because of the big difference in the fact that some of the transcriptional factors binding sites that we predicted didn't appeared with the PROMO. Finally, we find out that our matrices were really different from the ones used by PROMO. This is the reason why the results provided by our programme and the ones provided by PROMO are really different. If not it would be amazing!
To finish this trancriptional factor study we want to link all this data we have shown to our fusion gene. We think that the transcriptional factors that we get of the FIP1L1 gene will be the transcriptional factors that we would find in the promotor sequence of our fusion protein, because we have to remember that the first part of our fusion gene is generated by the first part of FIP1L1 gene due to the deletion of a 800-kb region. So the transcriptional factors that rules FIP1L1 gene will rule also FIP1L1-PDGFRA fusion gene.
![]() Back to the begining
Back to the begining
In this section we will try to explain a little bit about the expression of the proteins which center this webpage. To study the expression of both genes we began to analyse the chips and microarrays assays that shows the Gene Sorter webpage. If we analyse this page we have different tissues or cells where they have studied the presence or absence of the gene. There is an specific code because where the gene is highly expressed is red and when the gene is expressed less than a normal situation it is green. We consider that the red squares indicate where our genes are over-expressed, the black squares is where the gene is expressed in a normal concentration and the green squares indicated that this gene is repressed or less expressed in each tissue. So, with all this information we have done two tables where we can see different tissues or cells and diferent colours: in red there are the tissues in the organism that we find our gene over-expressed, in yellow we have tissues where the gene is neither over nor under-expressed and in green we have tissues where our gene is under-expressed. You can see the FIP1L1 expression description here and the PDGFRA expression description here [28].
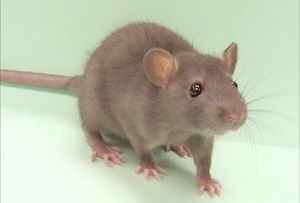
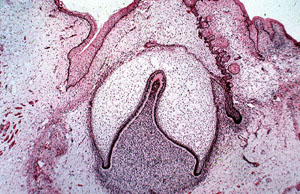
In addition to this, we tried to find images of the expression of the gene in the Visigene webpage. We find lots of images of the PDGFRA gene but this website doesn't have any images of the FIP1L1 gene expression. Now, we will show some images of Visigene to give examples and photographic probes of the expression of PDGFRA in mouse embryos [28].
| Tissue | Image |
| PDGFR and its ligand are candidates for mediating signalling between myotome and sclerotome [7]. |  |
| Infections with Shh-expressing retrovirus at embryonic day 9.5 result in ectopyc PDGFRA expression in the telencephalon by mid-embryogenesis [8]. | 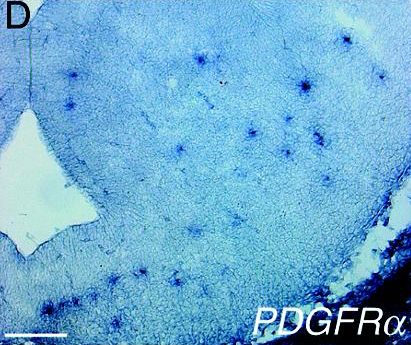 |
| The localized developmental expression of murine PDGFRA was compared with its ligand. They compare it in early axial structures, the skin and some of its derivatives, the developing forelimb, the branchial arches and various sense organs. They report that PDGFRA and its ligand are expressed in separate, but adjacent cell layers in these structures and that in most, the ligand is expressed in the epithelium, whereas the receptor in the mesenchyme. In the image we can see eyelid-lower-mesenchyme PDGFRA expression in pane J and eyelid-lower-epithelium PDGFA expression in pane K [9]. | 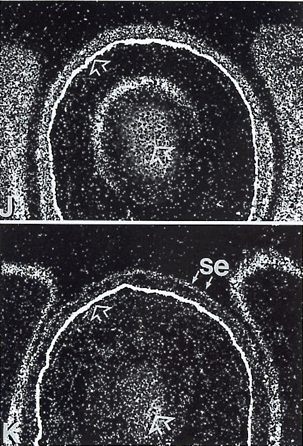 |
| In the image we can see left lung-lobar bronchus-mesenchyme PDGFRA expression in pane E and left lung-lobar bronchus-epithelium PDGFA expression in pane F [9]. | 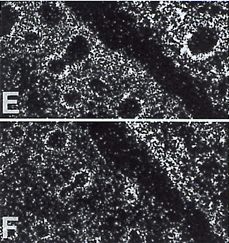 |
| In the image we can see mammary gland-mesenchyme PDGFRA expression in pane B and mammary gland-epithelium PDGFA expression in pane C [9]. |  |
| Expression of PDGFR alpha within the early embryo is first detected as the mesoderm forms, and remains characteristic of many mesodermal derivatives during later development [10]. |  |
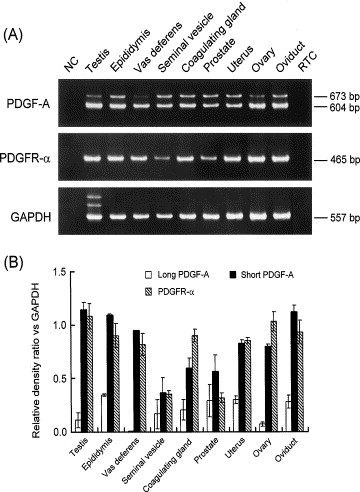
Moreover, we have seen that this gene is specially expressed in the urinary tracts and in male and female genitals, and searching in the literature we have found a graphic that shows this fact. The graphic shows that the PDGFRA is really expressed in the genitals, as we have said [11].
Although there is no data in GeneSorter and VisiGene databases for the FIP1L1-PDGFRA protein expression, scientist have demonstrated the expression of this fusion protein in the 50% of the pacients which suffer from HES. In some studies made in these pacients, they have obtained the fusion protein from blood cells. More data need to be done for knowing more about the fusion protein expression.
![]() Back to the begining
Back to the begining
In this section we will talk about the functions of both genes. Firstly, for each gene we will show general information about the main functions. On the other hand, in the second part of the function analysis we will show which functions we have found in Gene Ontology and we will explain all of them with some links that will bring you to a review or paper that comment each function or give some examples [29].
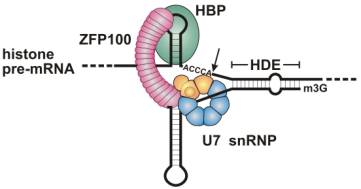
This protein is a component of cleavage and polyadenylation specificity factor (CPSF) complex that plays a key role in pre- mRNA 3'-end formation, recognizing the AAUAAA signal sequence and interacting with poly(A) polymerase and other factors to bring about cleavage and poly(A) addition. FIP1L1 contributes to poly(A) site recognition and stimulates poly(A) addition, it may act to tether poly(A) polymerase to the CPSF complex [28].
As FIP1L1 is very similar to FIP1 protein, we have been looking for that last protein. We have seen that it belongs to the Rab11-family interacting proteins (Rab11-FIP) which include, Rab11-FIP1, Rab11-FIP2, Rab11-FIP3, Rab11-FIP4 as well as Rab coupling protein (RCP) and pp75/Rip11 (Rab11-FIP5). All of the Rab11-FIP proteins described to date are associated with the plasma membrane recycling system containing Rab11a, and interact with Rab11 family members through an amphipathic alpha-helical motif in their carboxyl-termini Rab11 binding domain. Overexpression of the carboxyl termini of Rab11-FIP proteins generally inhibits plasma membrane recycling. Rab11-FIP proteins form homodimers and heterodimers in vitro. The two proteins share the Fip1 motif. This short motif is about 40 amino acids in length and in the Fip1 protein that is a component of a yeast pre-mRNA polyadenylation factor that directly interacts with poly(A) polymerase. This region of Fip1 is needed for the interaction with the Yth1 subunit of the complex and for specific polyadenylation of the cleaved mRNA precursor [12].
After this general expalantion of the function, we have found the function of the gene in GO and then, for each function we try to find some additional information in Pubmed.
 RNA binding (MF): Nowadays this gene have very unknown functions, however some scientist predict that this gene is involved in the polyadenylation and in the transcriptional process. So, it needs to bind RNA chains to regulate trasnscriptional and traductional steps. If you want to know more about this point you can click on this link [13].
 mRNA processing (BP): We also find that this gene is an actively player in the transformation from DNA to protein as a RNA modulator. If you want to know more about this point you can click on this link [14].
*We have to say that these images we have shown are related with the function, but what appears in the image isn't the FIP1L1 protein. MF = Molecular Function; BP = Biological Process.
This protein is a cell surface tyrosine kinase receptor for members of the platelet-derived growth factor family. These growth factors are mitogens for cells of mesenchymal origin. The identity of the growth factor bound to a receptor monomer determines whether the functional receptor is a homodimer or a heterodimer, composed of both platelet-derived growth factor receptor alpha and beta polypeptides.
After this general explanation of the function, we have found the function of the gene in GO and then, for each function we try to find some additional information in Pubmed.
 Nucleotide binding (MF): How we see in the promotor study of this gene, PDGFRA have lots of sites to bind some transcripitional factors. For this reason we can say that this gene have a specific function as a nucleotide ligand. If we search some additional information, we find that there are lots of papers describing mutations in the PDGFRA sequence that cause illnesses because it can't bind the transcriptional factors. Some examples of this are eosinophilia as you can see in this link [15], abnormalities of the tubal neural development as you can see in that one [16] and an illness called spina bifida as you can see in this last one [17].
Receptor activity (MF): Like his name indicates, this gene have a strong activity as a receptor. This gene is the receptor of platelet-derived growth factor alpha. Mutations of the sequence of this receptor cause some illnesses, an example of this is our fusion protein generated by a deletion that cause illnesses like CELL or HES . We can defind this receptor as a transmembran protein tyrosine kinase signaling pathway. If you want to know more about this point you can click on this link [18].
 Vascular endothelial growth factor receptor activity (MF): A function related with the last function is that this gene is the receptor of a vascular endothelial growth factor. Related to this function we find that this gene is involved in the cardiac tissue formation: the environmental induction of PDGFRA is important to the regulation of cardiac microvascular endothelial cell hemostatic and angiogenic activity. If you want to know more about this point you can click on this link [19].
 ATP binding (MF): As the majority of proteins that have a kinase domain it has an ATP binding site. In some treatments of eosynophils alterations we have seen that scientists intend to block this ATP binding site to block the kinase activity. If you want to know more about this point you can click on this link [20].
Integral to plasma membrane (CC): This is a protein that is linked integrally in the plasma membrane because its principal function is playing a role as a receptor as we have explained. Relationed to this point, we can affirm that this gene is a cell surface receptor linked to a signal pathway. If you want to know more about this point you can click on this link [21].
Protein amino acid phosphorylation (BP): The result to have a kinase domain is that PDGFRA is capable to phosphorylate some proteins or factors to induce or repress some pathways. We have reviewed some papers and we find that it has lots of targets to phosphorylate and it has an autocrine regulation because phosphorylates itself. If you want to know more about this point you can click on this link [22].
Cell proliferation (BP): The platelet-derived growth factor (PDGF) family of ligands and receptors play a pivotal role in the development of various organs. The critical importance of the PDGF-mediated signaling during embryonic development and adult physiology is very important to the development of the kidney, epidydimis, lung and pancreas. Searching in the Pubmed database we have seen that it is involved in lots of important mechanisms like the miocyts and fibroblasts differention and the endothelial cells proliferation. In contrast, we have to say that this gene has an active role in the development of some tumors or cancers. If you want to know more about this point you can click on this link [23].
![]() Transferase activity(MF): This a function relationed to the kinase activity that isn't described in the Pubmed literature [28].
Transferase activity(MF): This a function relationed to the kinase activity that isn't described in the Pubmed literature [28].
Extracellular matrix organization and biogenesislung development (BP): As we have said before it plays an important role in the differentiation or proliferation of different cells. So, it is involved in the organization of the extracellular matrix and in the biogenesislung development. We find that its important role in the matrix organization is present in some fibrotic illnesses. If you want to know more about this point you can click on this link [24].
 Male genitalia development (BP): Within the function as a proliferation regulator, this gene is very important in the male genitalia development. If you want to know more about this point you can click on this link [25].
Odontogenesis (BP): Platelet-derived growth factor A (PDGFA) binding to the PDGF receptor alpha (PDGFRA) mediates signal transduction processes related to DNA synthesis, cell migrations, cytodifferentiation, and wound healing. Recent studies indicate that PDGFRA functions during cranial neural crest cell migrations and first branchial arch morphogenesis are implicated to regulate tooth formation via autocrine mechanism during mandibular morphogenesis in vitro. If you want to know more about this point you can click on this link [26].
*We have to say that these images we have shown are related with the function, but what appears in the image isn't the PDGFRA protein. MF = Molecular Function; BP = Biological Process; CC = Cellular Component.
Here we show three maps where you can see how PDGFRA protein interacts with the other cell proteins and pathways: map1, map2 and map3 [21].
Here we have found the same problem that in other cases in this webpage: the function of the fusion protein remains unknown. The only thing we can say is that in patients with HES this protein acts as an activated tyrosine kinase. We have to say again that more data need to be done in this field.
![]() Back to the begining
Back to the begining
Now, we want to finish our work with this section where we will stand out the main concepts that we have shown of FIP1L1-PDGFRA gene. Firstly, we have to say that we are proud of having done this work, because it has allowed us to learn lots of things about all Gene Databases and we have spent a big amount of hours doing a perl programme and making our own webpage with HTML. These, has taken us many time but we believe that all the mistakes we have done and all the errors we have made will show us how to work when, in the future, we would have to confront a biology project.
When we started this work we didn't know anything about FIP1L1-PDGFRA fusion gene. Thanks to Pubmed literature we soon learn lots of things about the fusion protein and the two genes that composed it. After reading lots of papers we can conclude that PDGFRA gene is a very known gene in scientific world, whereas FIP1L1 is nowadays a novel gene that have to be investigate to learn more about it. Furthermore, the fusion gene had been discovered thanks to illnesses studies and there are lots of research groups that are trying to find out more information about it.
As you have seen before, we have distributed all the information we got in different sections. In each section we have described each gene and we have tried to relationate this information to the novel fusion gene that we have been analysing in all this work. We want to remark some aspects that we think that you have to bear in mind about this novel fusion protein.
When we characterized the structure properties of each gene we have realized that PDGFRA gene is larger than FIP1L1. If we focuse in FIP1L1, we have to say that it has 3 transcripts and studying other species trancripts, we may predict that this gene has some conserved splicing sites in its sequence. On the other hand, PDGFRA has 2 transcripts and we think that these transcripts aren't a result of splicing processes. In this point, we can say that our fusion gene is constituted by the first part of FIP1L1 gene and the last part of PDGFRA gene.
Talking about the isoforms , we have seen that FIP1L1 have 4 isoforms as a result of the splicing processes. In this point we have to remember that the Ensembl Database and Uniprot don't match, since in Uniprot we have found one novel isoform that we didn't find in Ensembl. On the other hand, PDGFRA gene has only two isoforms.
In contrast, if we focuse to the domain study , we have seen that PDGFRA has more important domains that give it a large fan of functions. FIP1L1 has only one main domain (FIP1) constituted of CPSF and PAPOLA regions. We also have to comment that our fusion protein have the FIP1 domain and the main domains of PDGFRA gene.
If we center now in the orthology part of this work, we have to stand out that some problems appeared. In the FIP1L1 we have done the phylogenetic tree and, as we have said before, its tree match with the phylogenetic structure of the species evolution . Moreover, if we analyse the homology percentatge, although we have to say that we can find this gene in lots of other species, we believe that when we have a low percentage it means that we can find one of the FIP1L1 domains in other different genes in other species and not the whole gene as an orthologue. On the other hand, with PDGFRA gene we find some problems to extract the databases information because Ensembl change its data from one day to another, and we don't know if the information that we got firstly was correct or not. However, we go on with this information to do two trees: in the first one we have reached the same conclusion we reached in FIP1L1 tree, and in the second one we have conclude that this family appeared before the species diversification.
In the transcriptional factors study, with PROMO website and after filter all the data obtained, we have been able to predict which trancriptional factors might bind with the promotor of each gene. In parallel, we have done a perl programme for predict the probability of 13 transcriptional factors to bind to our sequence. Results between PROMO and our programme are different due to the use of different matrices and different ways to solve the same problem.
To comment our expression section, we have to explain that both genes are involved in cell cicle process , so their expression is balanced in lots of tissues in our organism. However, we can predict that FIP1L1 is more over-expressed in immunitary system and PDGFRA is more expressed in brain regions. Both genes are expressed in fetal tissues, specially PDGFRA. In this point, we also have compared the normal expression with the tumoral expression, because these genes are involved in lots of cancers and tumors processes.
Finally, FIP1L1 isn't a very well-known gene and function as an RNA modulator. In contrast, PDGFRA have lots of important functions as a result of its kinase domain and its Ig-like domain. We can relate some functions of both genes with what we know about the FIP1L1-PDGFRA, and we may think about the fusion protein can be implied, for example, in the regulation of cell production , specially eosynophils. This will explain the fact that there is an over-production of eosynophils in some illnesses with the presence of the FIP1L1-PDGFRA fusion protein.
Last, but not least, it should be said that this novel gene needs more investigation around it. We are sure that in the following years, more information will be finded out of the function of this gene. Scientist also are working in discover the molecular target of imatinib in HES since, as we have said before, it remains unknown.
![]() Back to the begining
Back to the begining
In this last point of this webpage we want to thank to all the people that have helped us in the elaboration of this work. First of all, we want to thank to Domènec Farré and Mireya Plass who where the responsibles of our practice group and have helped us in all the matters that has appeared during the elaboration of this work. We also want to thank to Robert Castelo who has answered all the questions we have asked by mail. Thank you too to Roderic Guigó for teaching us in lots of aspects than have been basics in this project. Moreover, we want to thanks to our class colleagues for solving doubts and accompanying us in this hard work. Last but not least, we want to thank to each other, since we have spent a lot of hours together solving all the problems that have appeared and working a lot of hours to do this webpage of which we are very proud of.
We hope that all the hours and efforts we dedicated to this work will allow you to know more about FIP1L1-PDGFRA gene. In our opinion, this academic work have allowed us to know lots of things that we will never forget about Internet Databases, perl programming and html method to do webpages. Thank you for the time you have dedicated to read this webpage!
![]() Back to the begining
Back to the begining