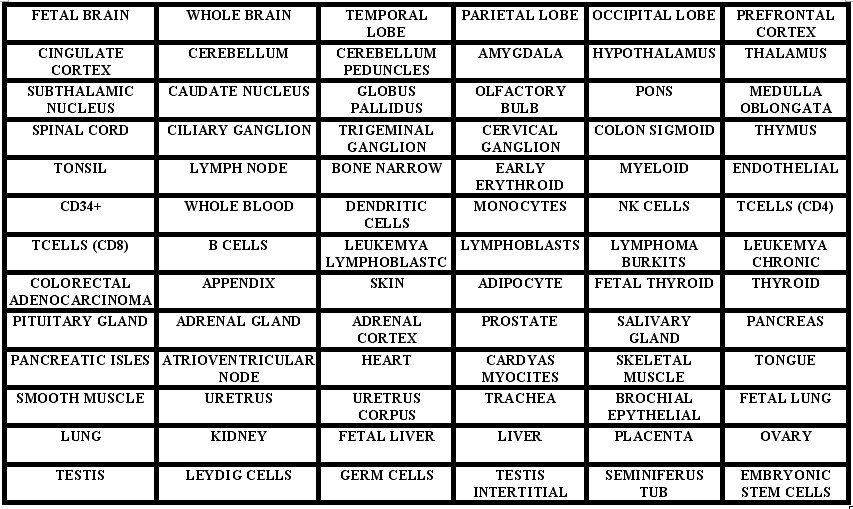
This is the table where we can see the principal tissues or cells that we have chosen to study the expression of our genes. If you pass the cursor over the table it will be colored. We can find three colors: red indicate tissues where our gene is over-expressed, yellow for tissues where the gene isn't over-expressed or under-expressed and green is the colour that means that the gene is under-expressed in this tissue. We have to say that it is an approach of the expression of our gene, it is a qualitative study but it gives us strong information about where PDGFRA gene is expressed.
If we analyses the table, we can see that this gene is very expressed in:
We have to remark some special cases. For example, in the fetal brain the PDGFRA is over-expressed all around it. But then in the adult the expression is regionally restricted, since there are some brain regions where it is under-expressed and others where it is over-expressed.
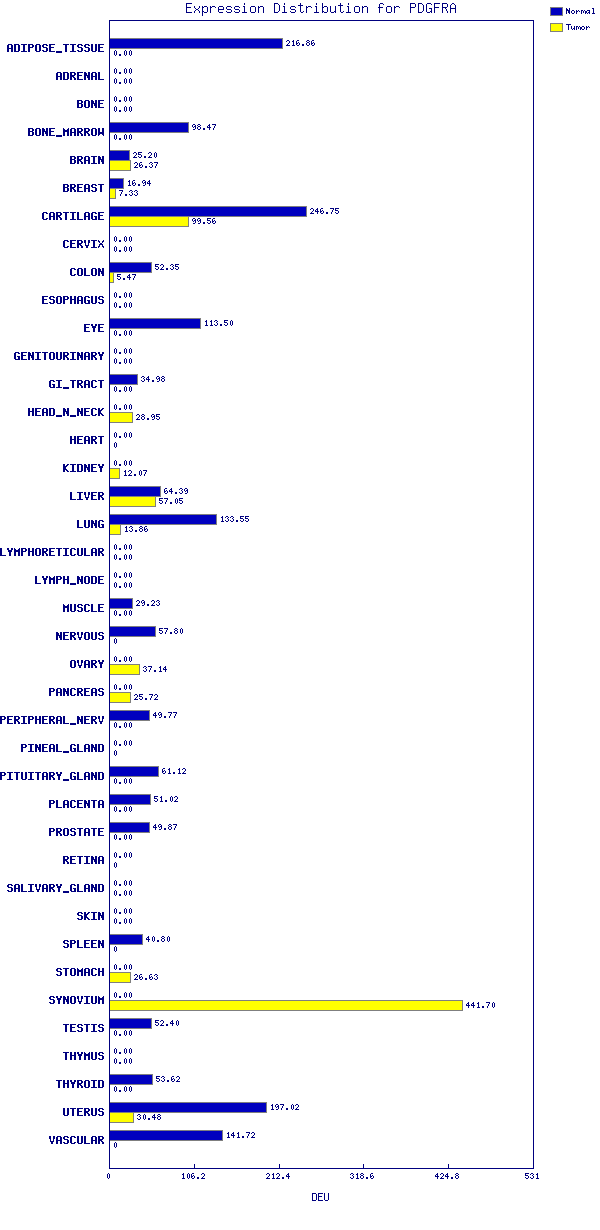
Looking for quantitative values we have found the following graphic where it compares the expression in normal cells with the expression in tumoral cells. We have found it in the GeneHub-GEPIS database. In the whole, tissues we have shown in the table with over-expression of PDGFRA gene have also over-expression in this graphic. There are a few cases where the two databases doesn't coincide in their results.